



A big survey on employee productivity in different work setups
How work environments shape performance across local tech teams. Insights from 2025.


About the survey
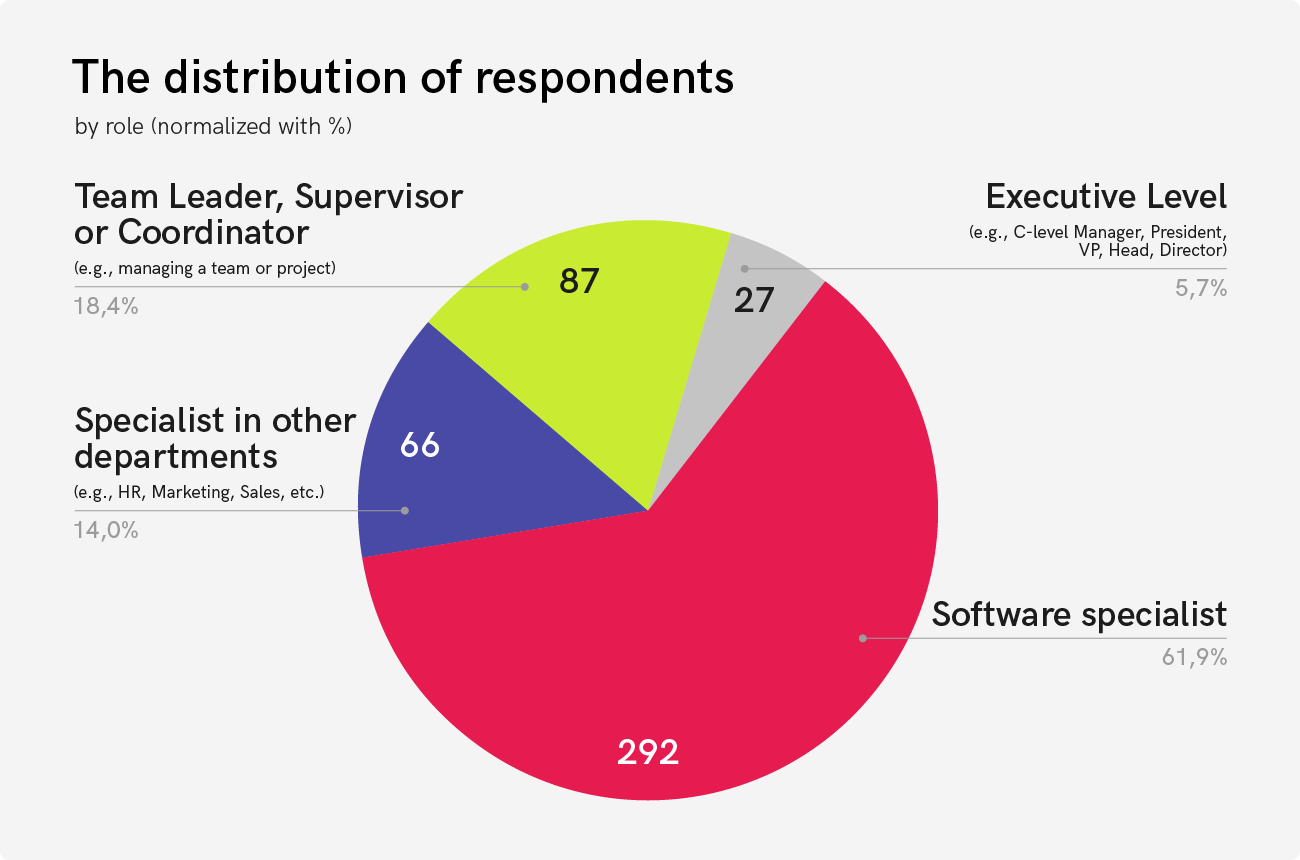
In 2025 we surveyed 471 tech professionals in Central and Eastern Europe, including software engineers, team leaders, executives, and specialists from HR, marketing, and sales.
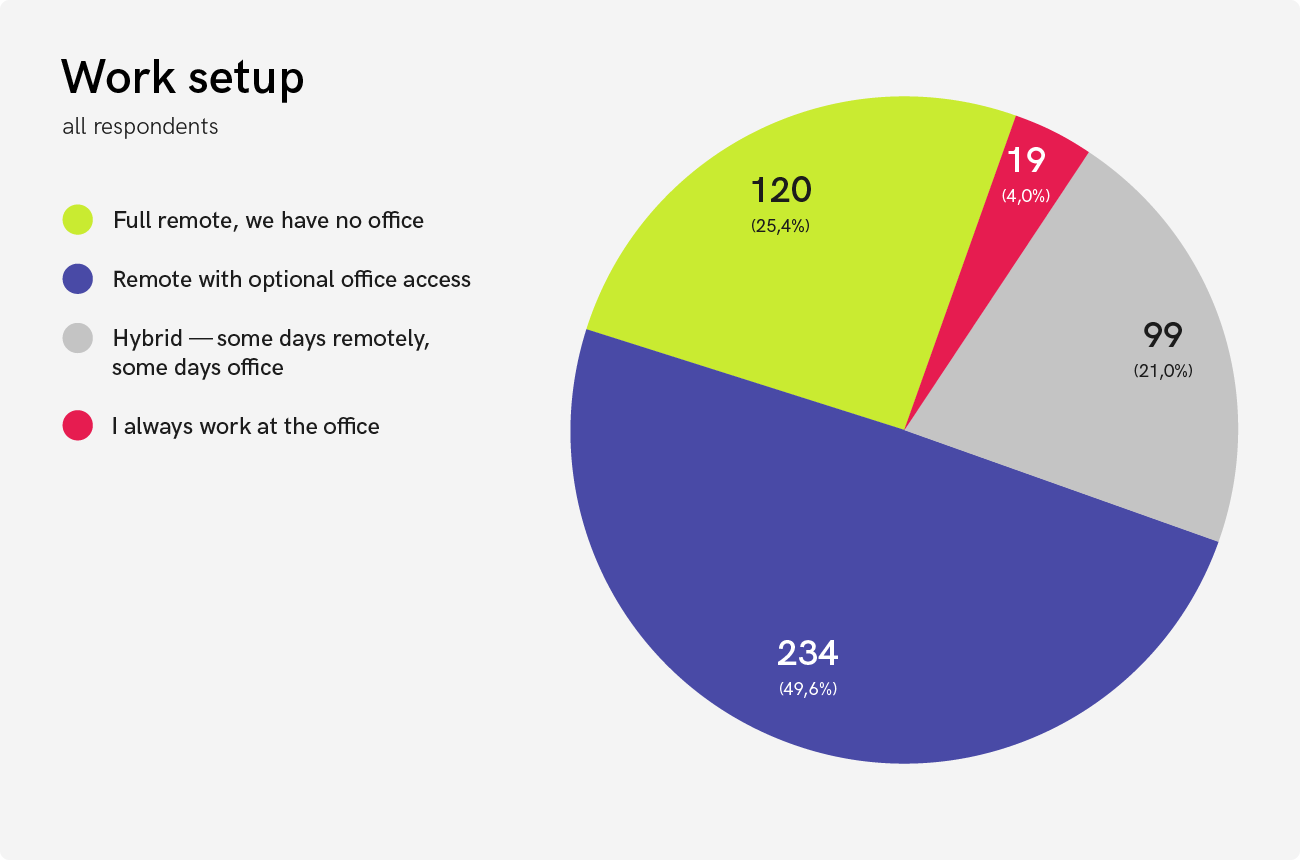
Respondents worked in four main setups:
- fully remote
- remote with optional office access
- hybrid (some days office, some remote)
- and office‑only
All questions where people rated productivity, career growth or meeting effectiveness used a 5‑point scale, where 1 means “very poor” and 5 means “excellent”.
Current work setup
This section shows how people actually worked in 2025.
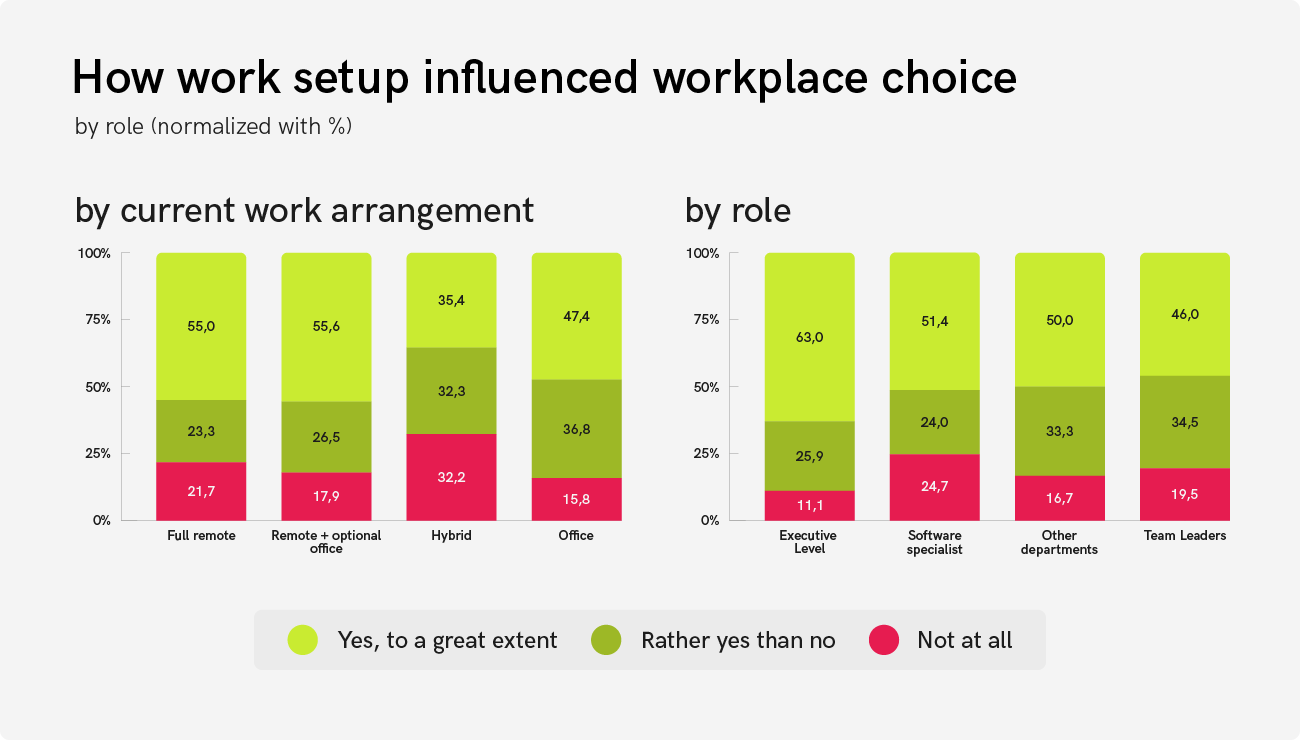
Impact of work setup on workplace choice
Here we focus on how much the proposed work format influenced respondents’ choice of workplace.
[fs-toc-h2]Personal productivity
[fs-toc-omit] [ 1 ] Personal productivity
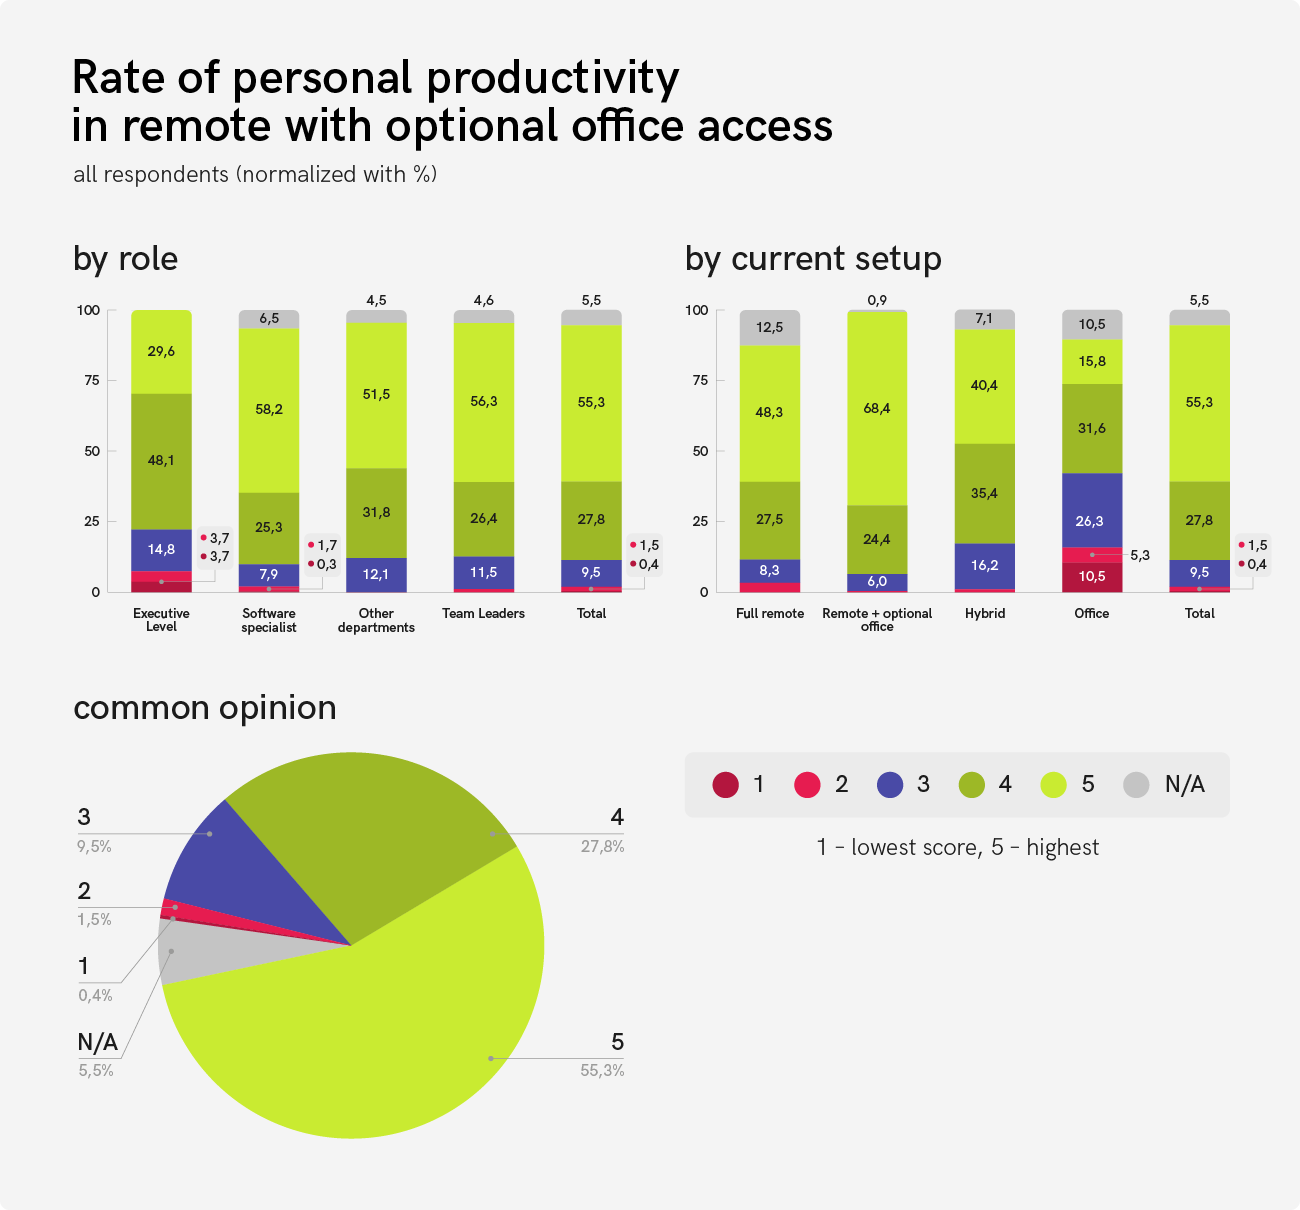
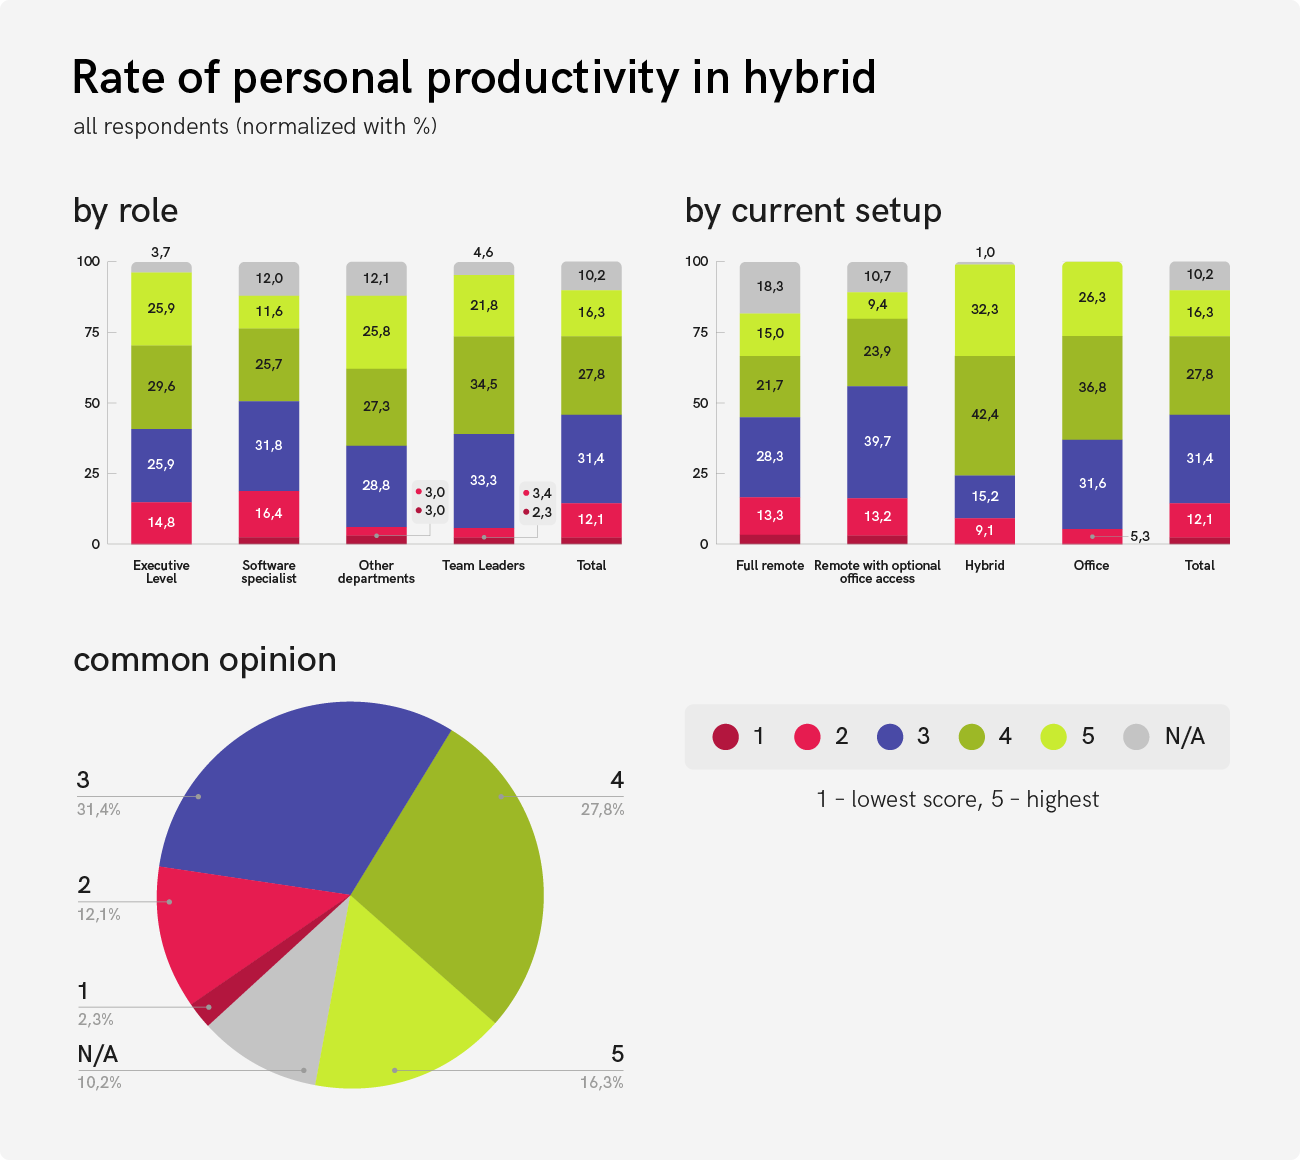
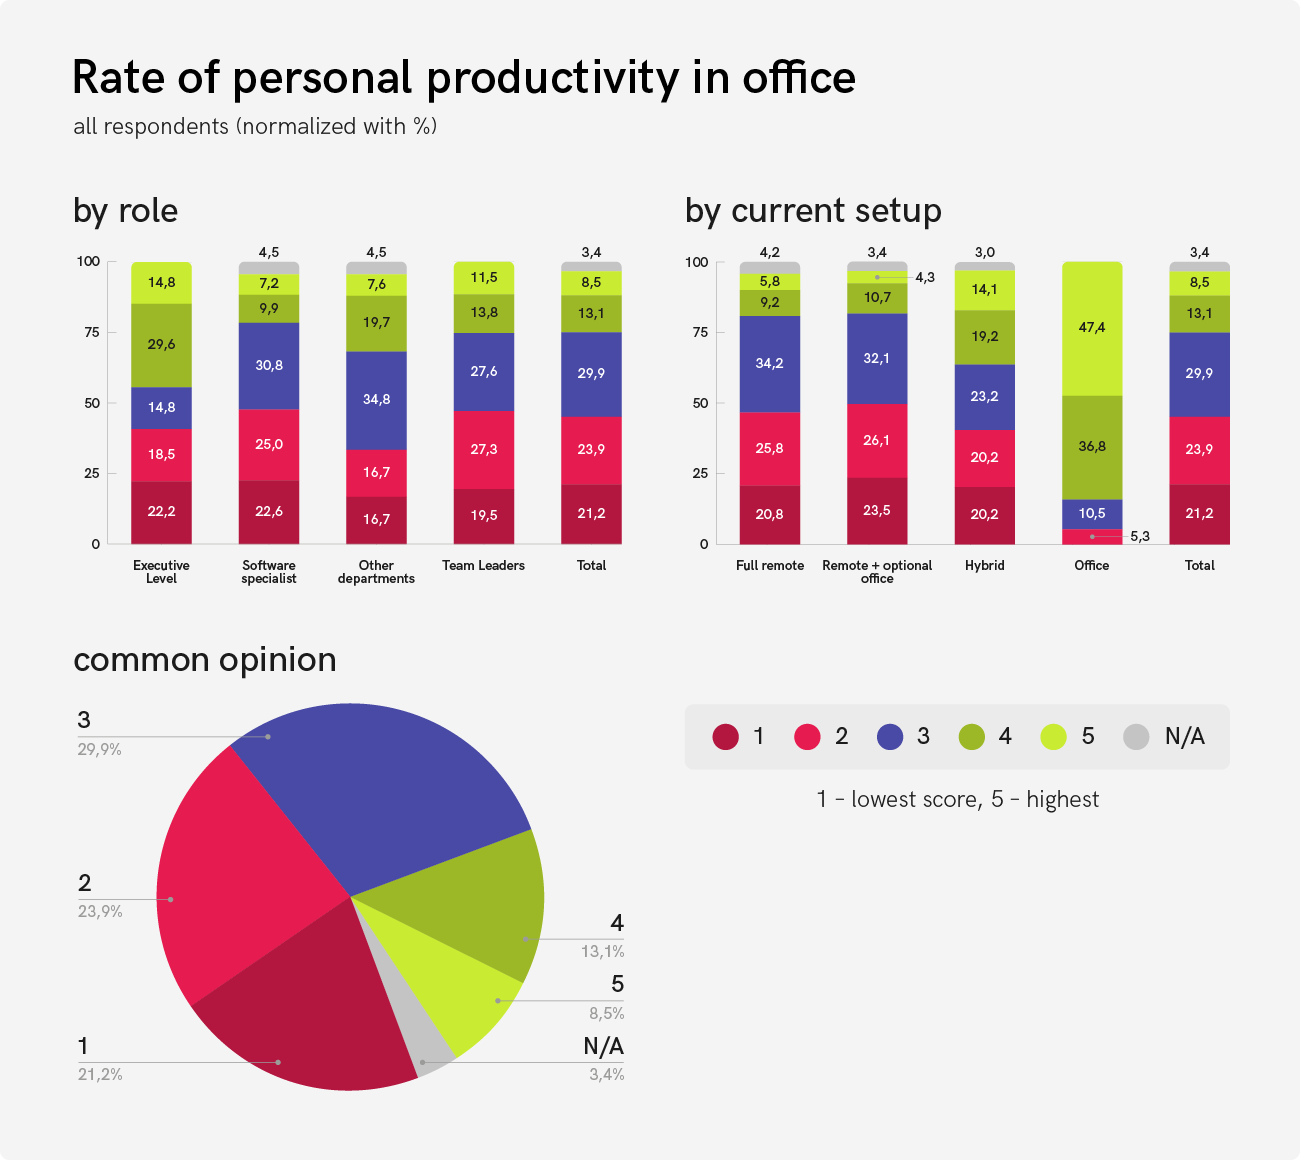
In this section respondents rated how productive they personally felt in different setups. Each group of charts shows both an overall view and a breakdown by role.
— Full remote

— Remote with optional office access
— Hybrid
— Office
[fs-toc-h2]Team productivity
[fs-toc-omit][ 2 ] Team productivity
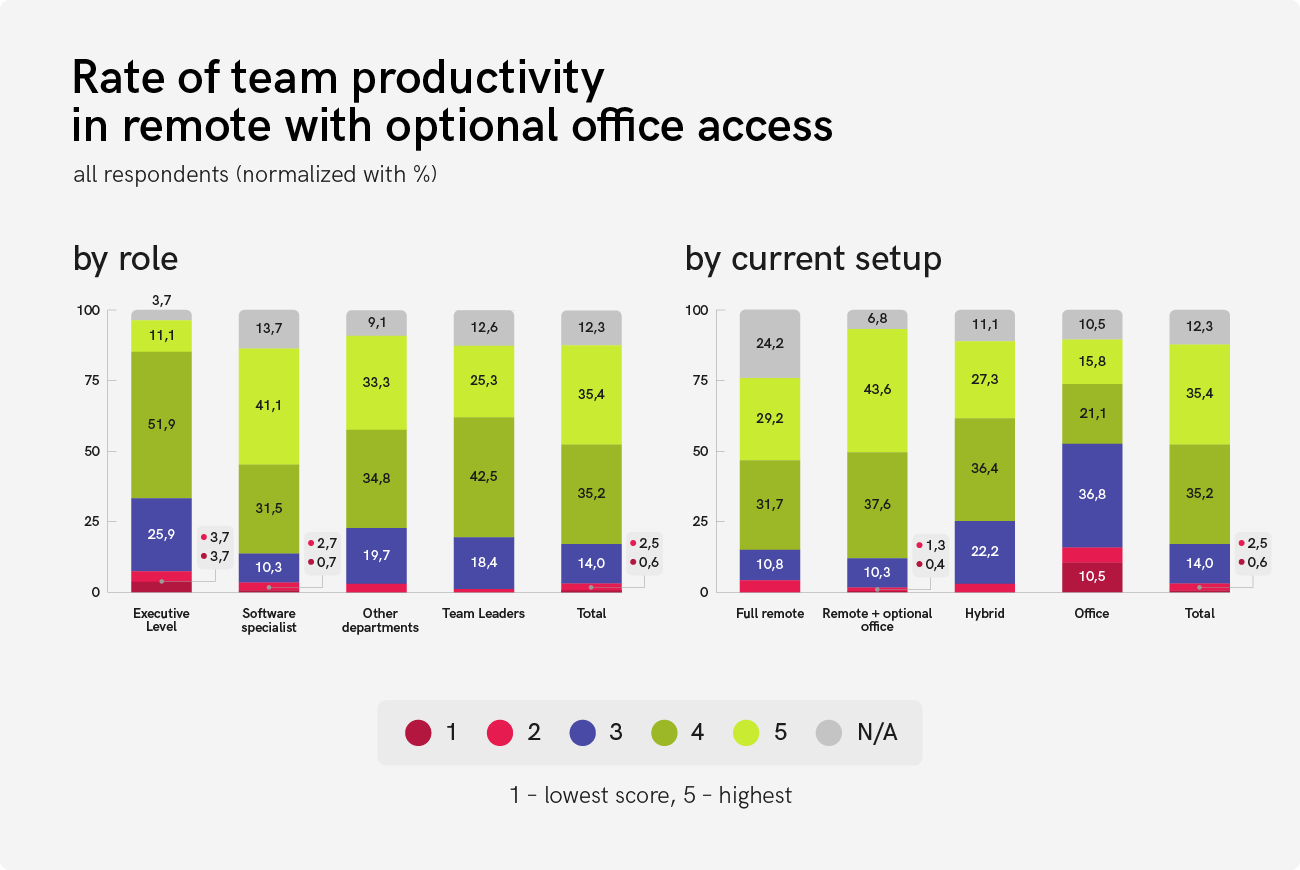
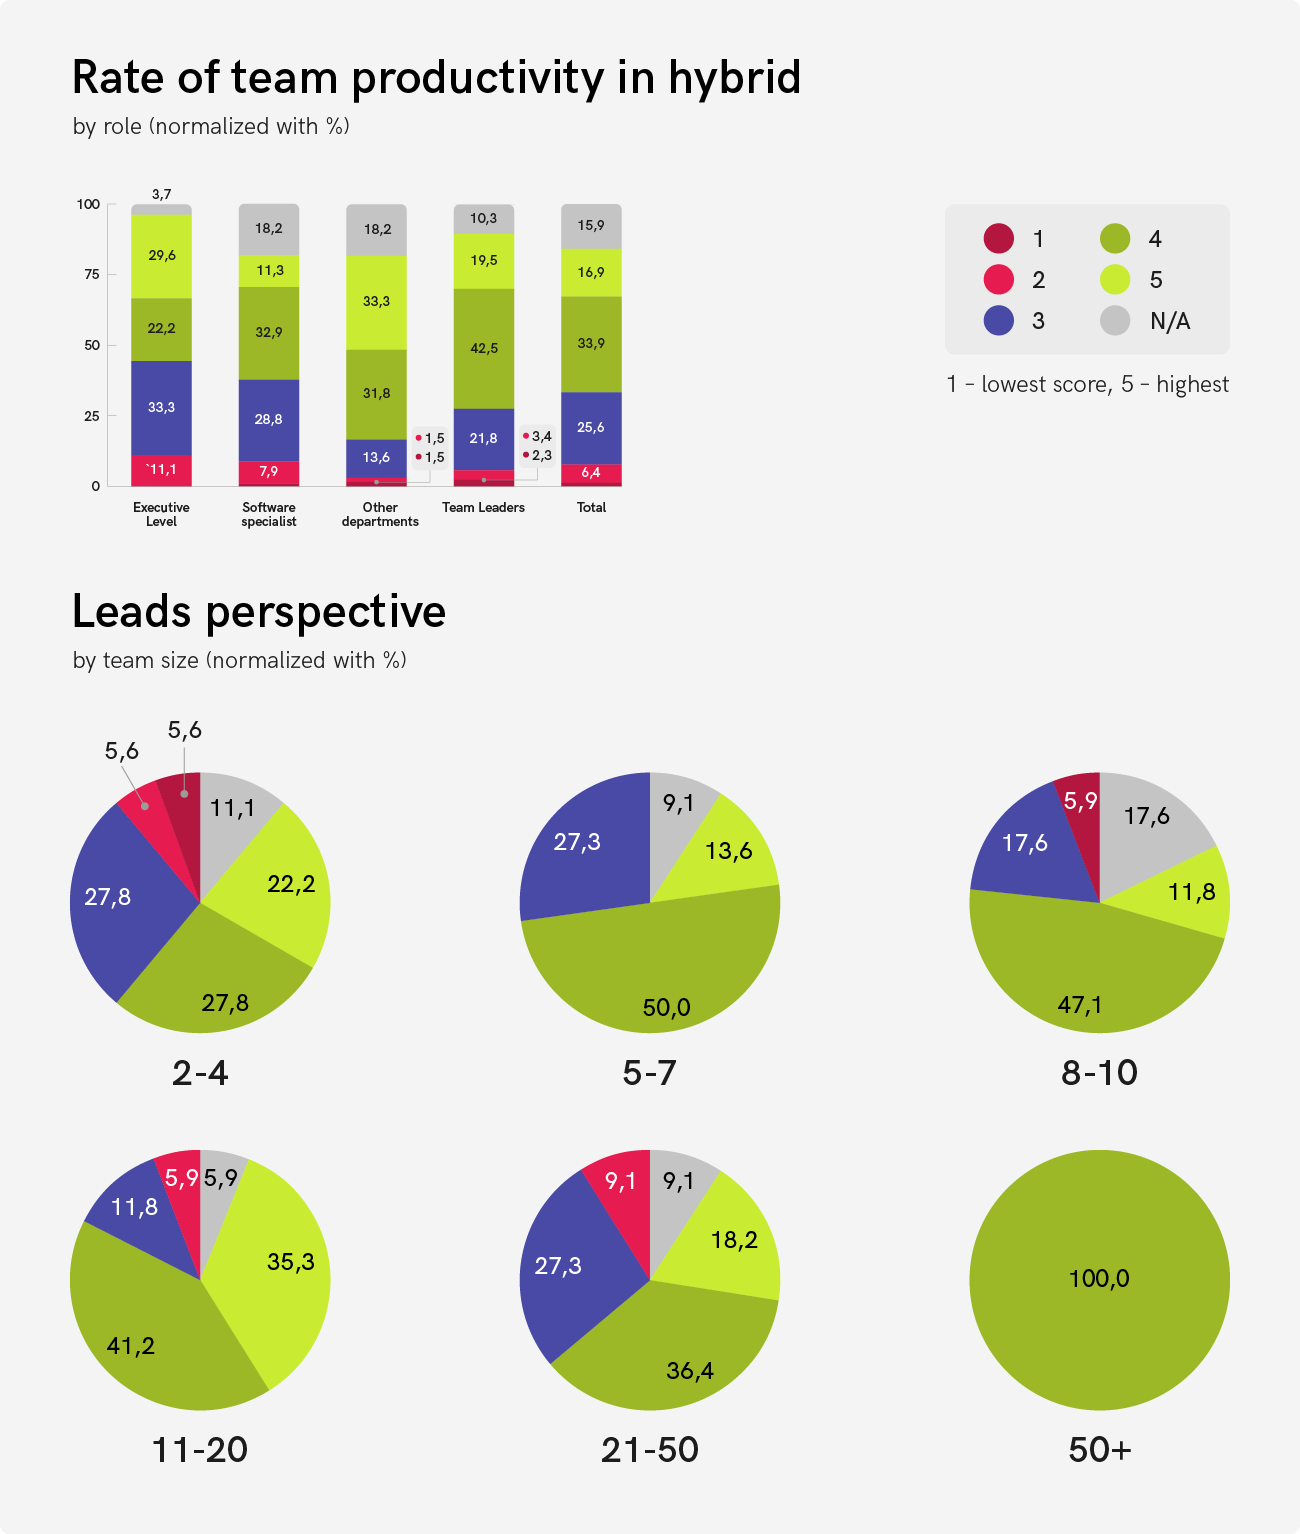
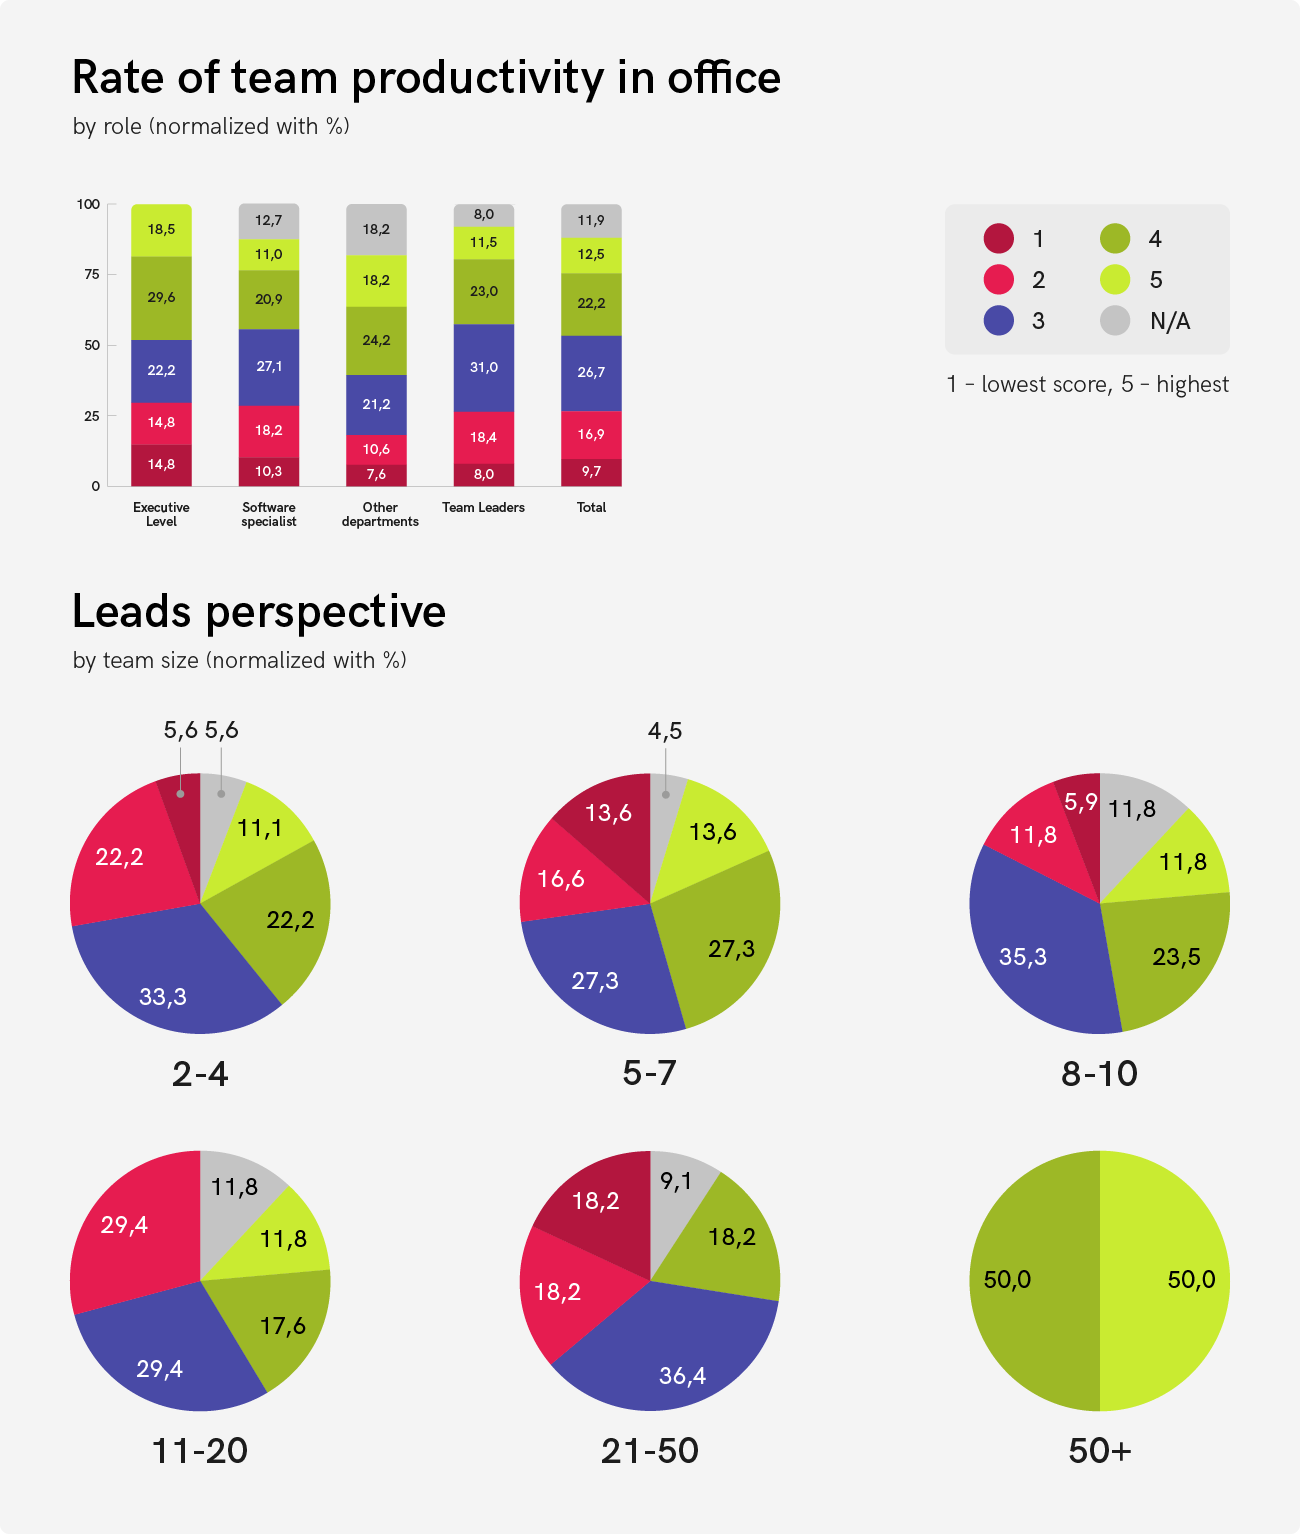
Here respondents evaluated how productive their teams were in each format. We looked both at role‑based results and at how perceptions change with team size.
— Full remote

— Remote with optional office access
— Hybrid
— Office
[fs-toc-h2]Meeting effectiveness
[fs-toc-omit][ 3 ] Meeting effectiveness
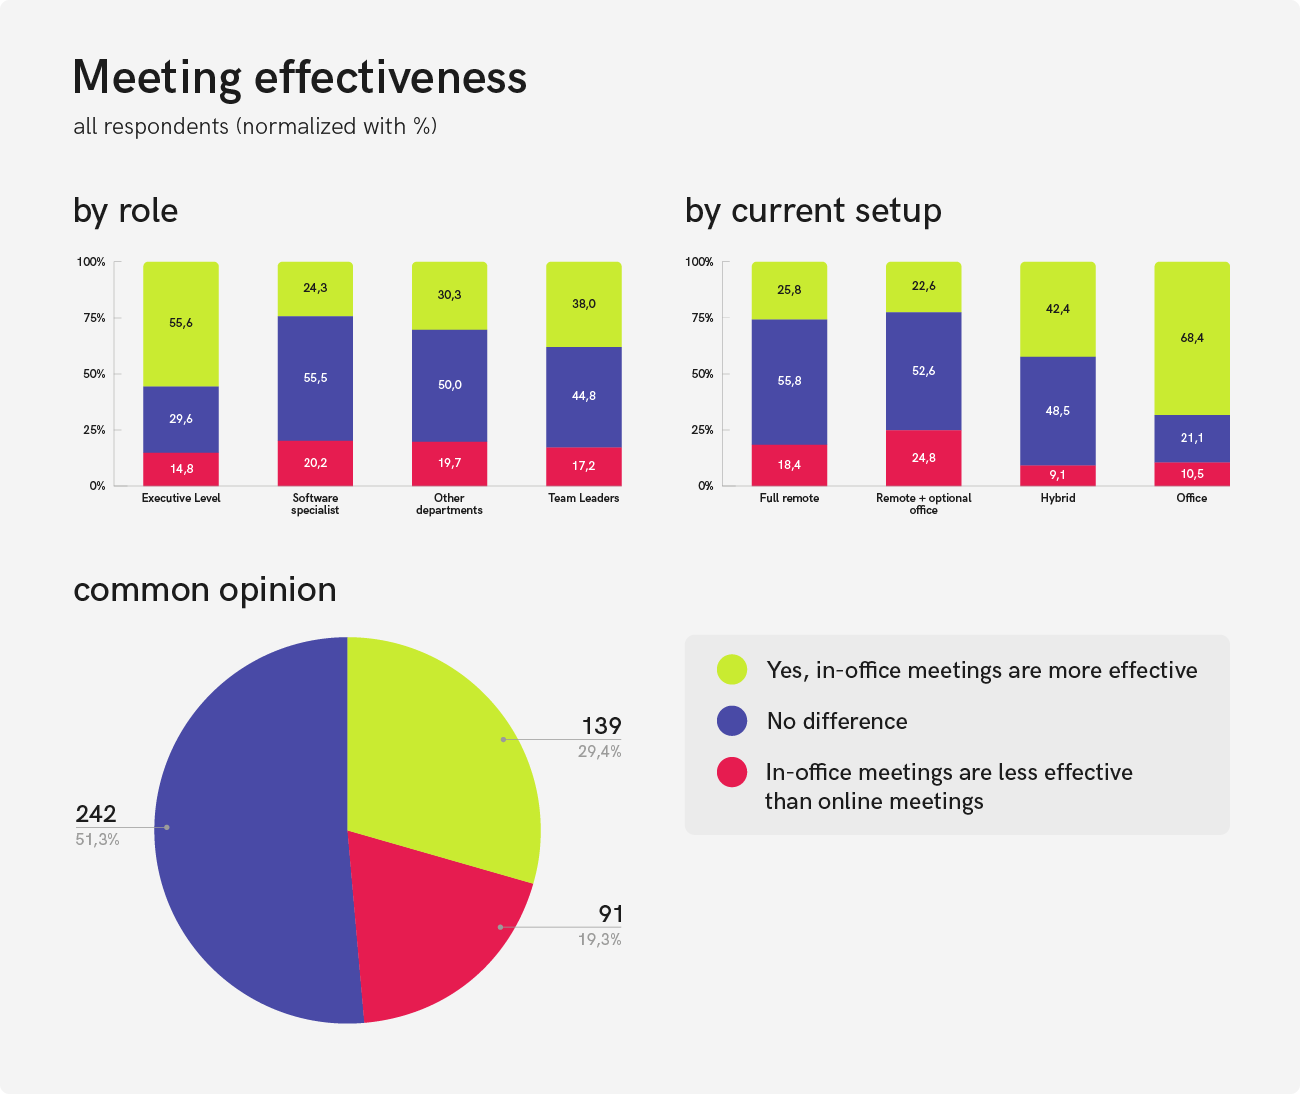
In this block, respondents evaluated which meeting format they considered most effective.
[fs-toc-h2]Career growth opportunities
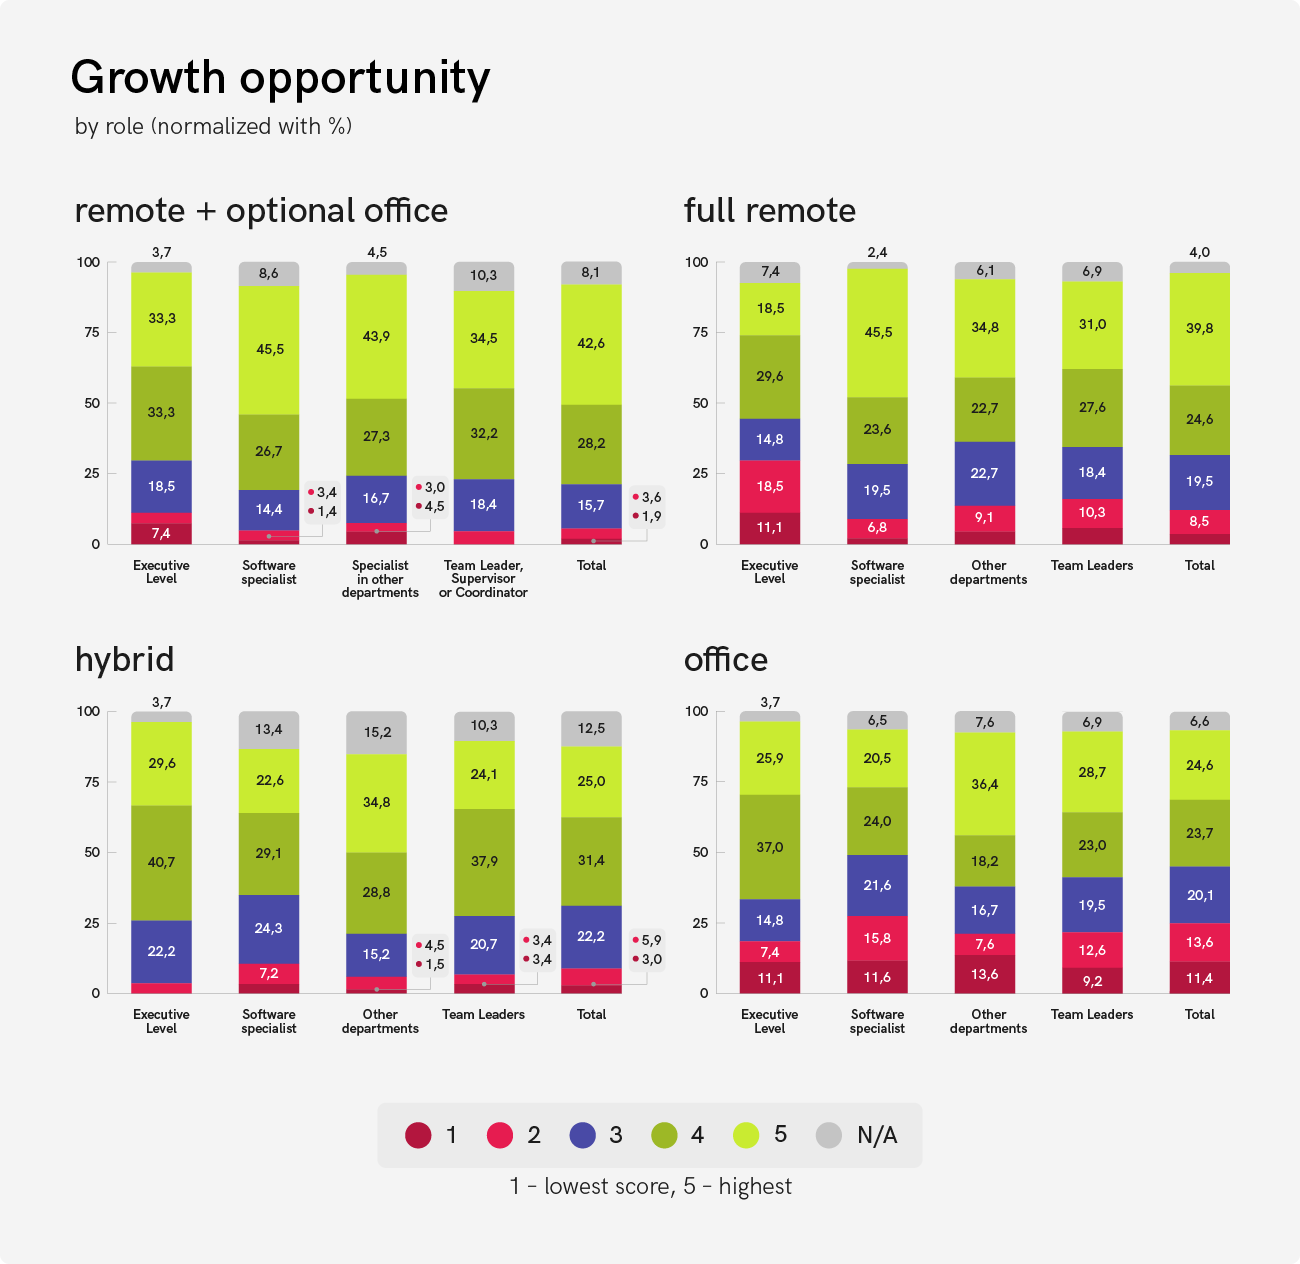
[fs-toc-omit][ 4 ] Career growth opportunities
Here respondents rated how good each work setup was for long‑term career growth.
[fs-toc-h2]How people would structure work in their own teams
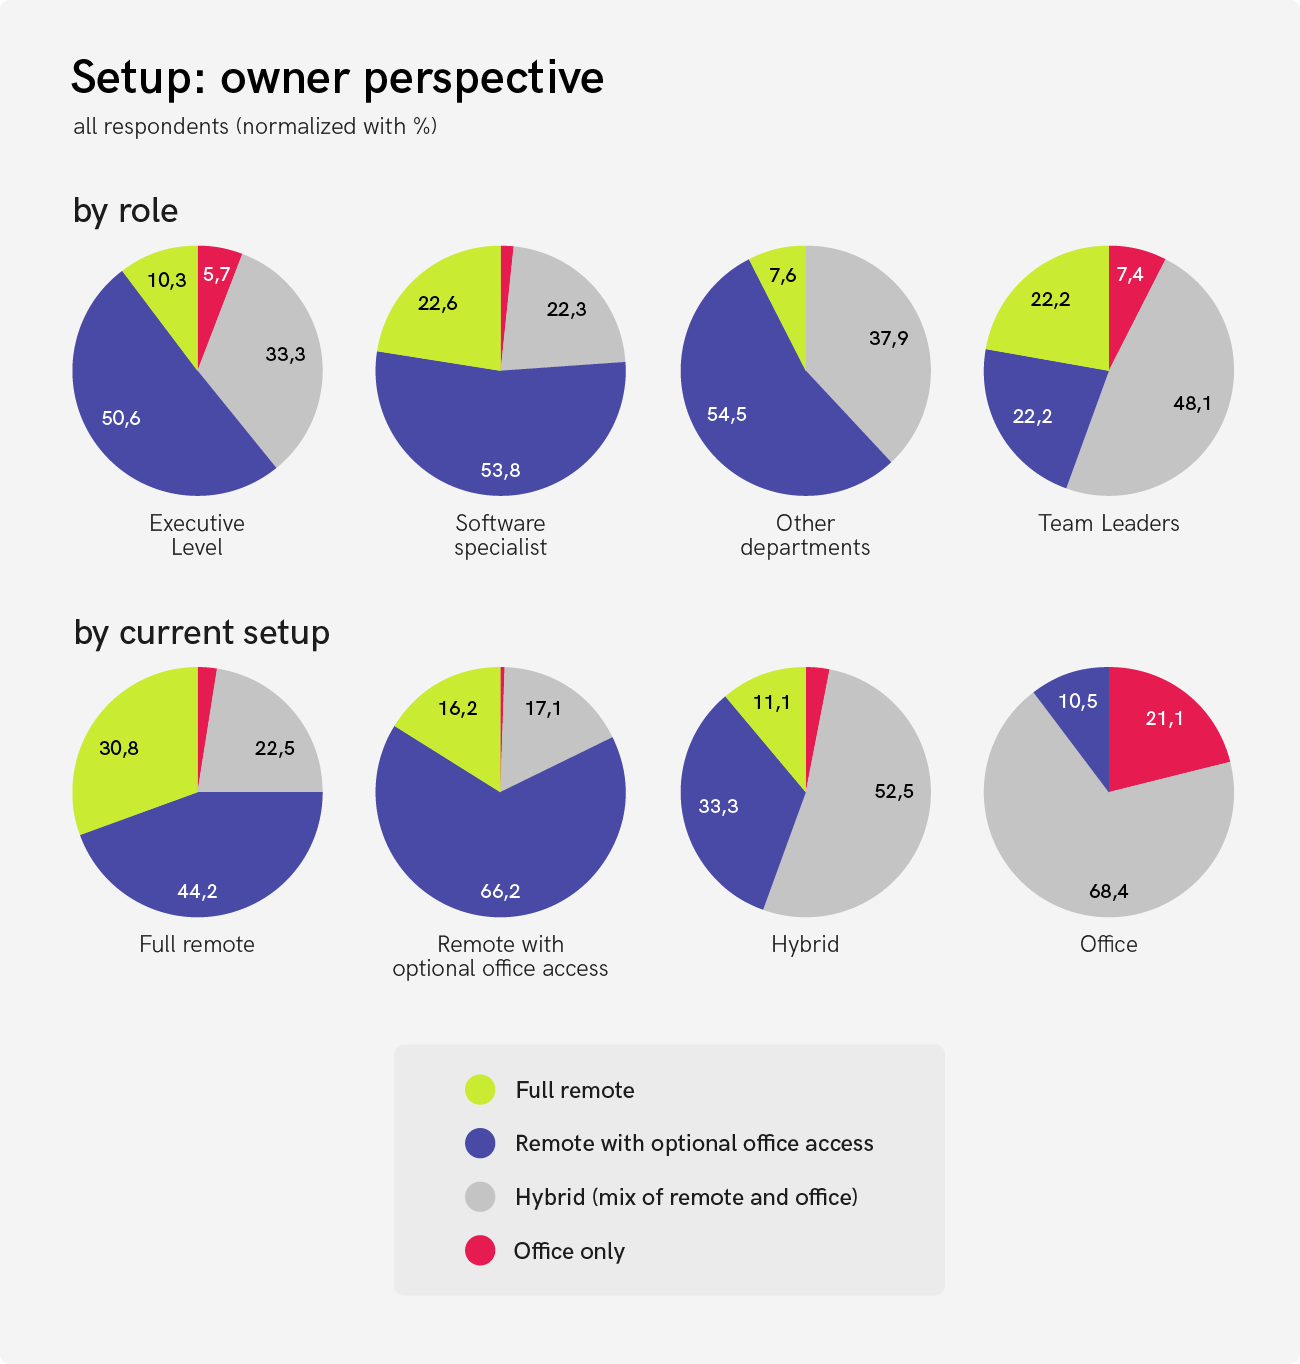
[fs-toc-omit][ 5 ] How people would structure work in their own teams
Finally, we asked people what format they would choose if they were business owners deciding how their employees should work.


Stay in tune
with On The Spot
You've successfully signed up for our newsletter. Keep an eye on your inbox.
Read more
Discover what else is happening at On The Spot
TechSpot
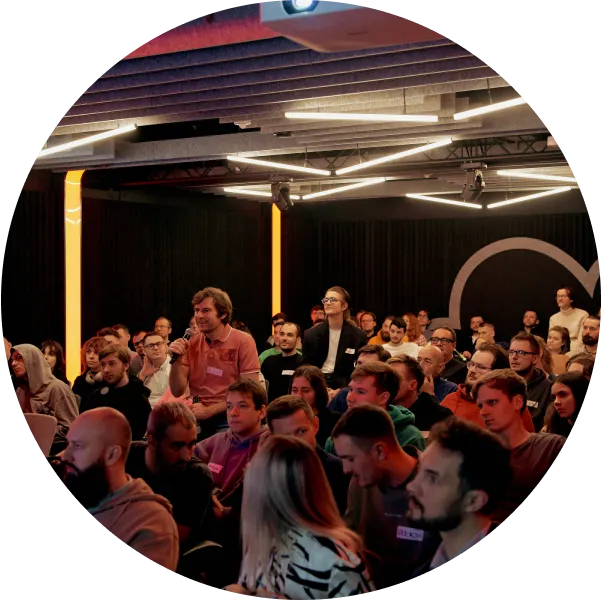
Tech events in Poland and online for everyone interested in software architecture and systems design. Like-minded people, top experts from leading companies, and a big engineering community.


137 Podcast
Conversations with top engineers, CTOs, and founders about day-to-day engineering and everything that excites us about tech.